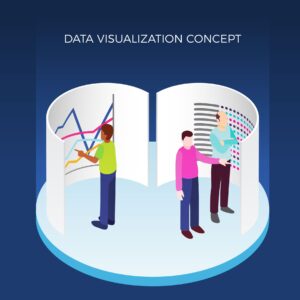
What is Business Data & Visualization?
Business and data visualization is the art and science of transforming raw data into meaningful insights through graphical representations. It involves using charts, graphs, and other visual tools to interpret complex data sets, making it easier for stakeholders to understand trends, patterns, and outliers. By leveraging visualization techniques, businesses can gain actionable insights, enhance decision-making processes, and effectively communicate data-driven stories. This practice not only simplifies the interpretation of data but also reveals hidden opportunities and potential risks, enabling companies to make informed, strategic decisions. By making data accessible and actionable, Business Data & Visualization empowers organizations to leverage information fully, enabling quicker and more informed decisions that drive growth and competitive advantage.


Business Data & Visualization Services
Tech Cryptors provides expert business and data visualization services, transforming raw data into insightful, actionable visuals that empower informed decision-making. By leveraging tools such as Tableau, Power BI, Alteryx, Python, R, and SAS, Tech Cryptors offers a comprehensive range of IT solutions that include detailed plots, interactive dashboards, compelling data stories, tables, and geo-maps. This tailored approach helps businesses not only uncover hidden insights but also optimize operations and identify new growth opportunities. Through clear, visually engaging representations, Tech Cryptors enables companies to make strategic decisions with confidence.

